


Make your ideas shine with Designity’s Graphic Design & Illustration services. From infographics to 3D visuals, we’ll help you captivate your audience.
Experience the magic of 2D / 3D illustrations & Product Visualizations, merging the essence of stock visuals, engaging icons, and unique designs tailored for various formats. Discover seamless resizing options, ensuring your visuals maintain pristine quality across platforms. Dive into a world where simple interactions meet motion, creating an immersive experience for users. With these illustrations, communicate your message vividly and make every visual count. Ideal for websites, mobile apps, and digital campaigns. Collaborate with your designated Creative Director at Designity and let your visuals narrate your story.
For clients seeking to captivate audiences online, GIF Animation services at Designity present a dynamic solution. Dive into a 60-minute Strategy Session to harness the potential of GIF animation design. Experience the power of Simple Interaction or Motion and seamlessly Insert Existing Visual & Written Content to bring concepts to life. GIF animation services express emotions and scenarios more vibrantly, making them perfect for capturing attention. Not just a digital novelty, these animations can drive clicks, maintain audience engagement, and offer relatability in content. Stay current with the digital language, and communicate more effectively with GIF Animation services.
Enhance your brand's visual appeal with our specialized fonts at Designity. Distinctive typefaces can elevate your website's look, making it stand out and maintaining visual coherence across various platforms. Gone are the days of solely depending on generic or typical fonts. Thanks to web browser enhancements and CSS advancements, you can seamlessly integrate dynamic, unconventional fonts into your website's HTML and CSS. Designity's platform offers a user-friendly approach to updates, upkeep, and adaptability, offering a superior alternative to traditional images for personalized typography. Achieve greater control, accessibility, and functionality without sacrificing SEO or design excellence.


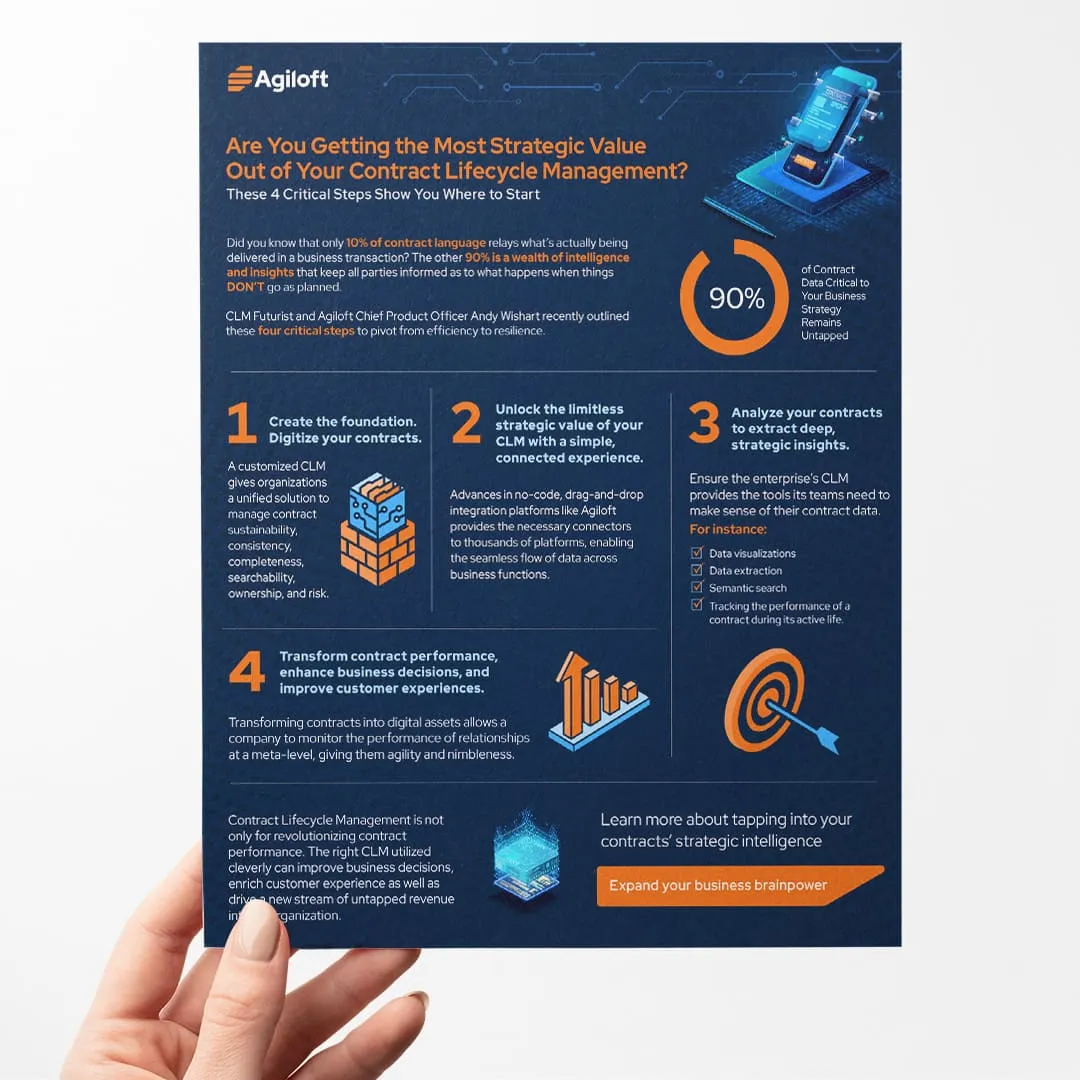

Infographic & Data Visualizations: Trends & Insights
6 Ways Designity Helps Teams Ship Faster and Scale Smarter

100+ Creative & Marketing Services

Dedicated Creative Directors

Top 1% of Fully Vetted Talent

Faster Turnaround Times

Flexible, Cost-Efficient Plans

Brand-Trained AI Assistant


Designity
Creative Team
Creative Director
Avg Monthly Cost
Up to 2-Week Trial

Marketplace
Creative Team
Creative Director
Avg Monthly Cost
Up to 2-Week Trial

In-House
Creative Team
Creative Director
Avg Monthly Cost
Up to 2-Week Trial
Agency
Creative Team
Creative Director
Avg Monthly Cost
Up to 2-Week Trial

Book a demonstration call with Designity to understand:
- How we personally match you with a Creative Director with 10+ years of experience


Why 850+ Brands Trust Designity
What Clients Say About Our Speed, Quality, & Workflow

Insights for Modern Creative & Marketing Teams
FAQ

Infographics and data visualization require specialized skills within the realm of graphic design. Designity offers you access to a vetted pool of global creatives and Marketers with expertise in infographics, data visualization, and related fields. Whether your project demands an expert in translating complex data into visually compelling graphics, an illustrator with a knack for simplifying information, or a designer skilled in crafting engaging infographics, you can find it all on Designity's platform.
What sets Designity apart? Our platform employs advanced automation to ensure efficiency across all projects, ensuring you meet your deadlines without hassle. We provide access to vetted Creatives and Marketers who specialize in various design categories, eliminating the need to manage multiple providers. Additionally, our transparent monthly subscription model offers a cost-effective alternative to project-based retainers with hidden fees. With Designity, you gain a trustworthy team dedicated to bringing your infographics and data visualization ideas to life, so you can focus on your creative vision. Say hello to a seamless creative partnership.
Designity's platform offers a wide range of infographics and data visualization services, including data-driven infographics, interactive infographics, statistical charts, information dashboards, data storytelling, and custom data visualization. Our skilled designers can transform complex data into visually appealing graphics, provide interactive online experiences, and craft custom visuals tailored to your specific data needs. Whether you want to present market trends, research findings, business metrics, or any other information, Designity's experts can create engaging and informative infographics and data visualizations to effectively communicate your message.
For additional design services, feel free to explore other offerings under Graphic Design & Illustration, which include:
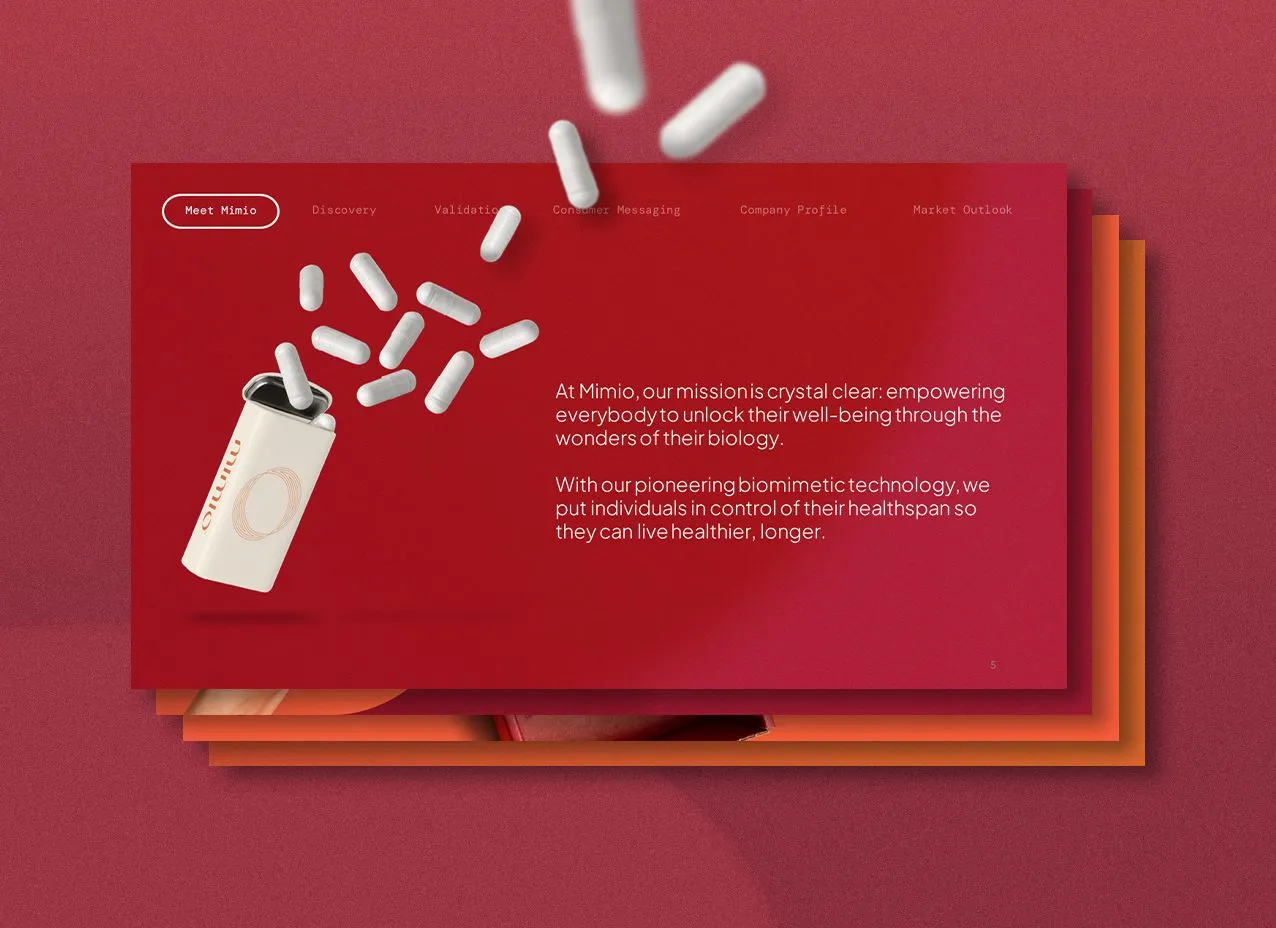
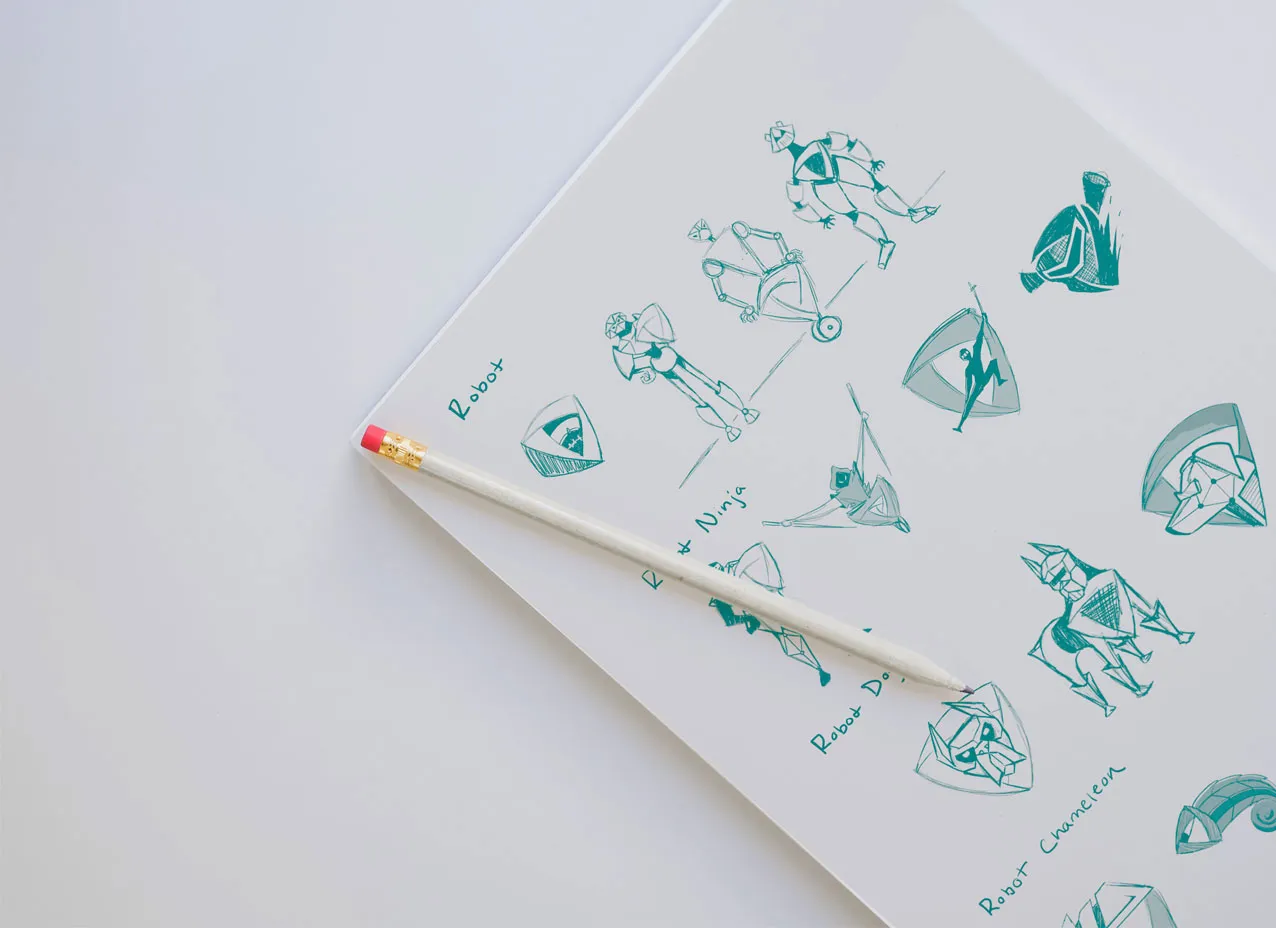
- 2D / 3D Illustrations & Product Visualizations: From paper to pixels, we breathe life into your ideas. It’s like a digital magic show where your concepts take center stage.
- GIF Animation: Make visuals dance, jump, and wink with GIFs that grab attention. Imagine your brand doing the cha-cha on screens everywhere.
- Icon & Pattern Creation: We’re in the business of making icons iconic and patterns pattern-tastic. Your brand gets a signature style that’s instantly recognizable.
- Print Advertising: Think of us as your go-to for print magic. From brochures to billboards, we craft designs that make paper feel proud.
Freelance infographic and data visualization designers usually charge based on their level of expertise, ranging from $40 to $250 per hour. Design agencies often have varying pricing structures. However, Designity offers you a hassle-free experience with transparent monthly, quarterly, or annual plans starting at just $5,995 per month. No hidden fees, no surprises – just reliable design services.
Infographics and data visualization projects vary in duration, typically ranging from a few days to a few weeks. The timeline depends on the complexity of the data, the intricacy of the design, and the number of visualizations required. Designity's platform excels in delivering timely and high-quality infographics and data visualizations by harnessing efficient automations and a streamlined creative process. With the support of your designated Creative Director and Project Manager, we ensure that your project is managed effectively from inception to completion, allowing you to enjoy both timely and exceptional results.
The infographic and data visualization design process, where data takes the stage and transforms into captivating stories! Here’s the breakdown:
- 60-min. Strategy Session: Like a brainstorming session on steroids. You'll be amazed at the data's potential.
- Data Collection & Analysis: The treasure hunt for the numbers that will shape your narrative.
- Visual Conceptualization: Turning data into engaging visuals that tell a compelling story.
- Drafting Infographics & Data Visualizations: This is where the magic truly happens – bringing data to life in ways that resonate.
- Revision and Refinement: Fine-tuning the visuals for maximum impact and clarity.
- Review and Feedback: Getting input to ensure the data’s singing the right tune.
- Finalization and Design Optimization: Polishing every detail for a flawless presentation.
- Exporting and Sharing: Sharing your data story with the world, be it in reports, presentations, or online.
- Presentation and Implementation: Showcasing your infographic or data visualization to captivate your audience.
Once you have a process in place, the only question left is how you’re going to execute it and with what talent. This is where Designity comes in. With a knack for tackling design challenges head-on and a commitment to delivering solutions that exceed expectations, Designity stands as your ideal ally to amplify your brand's message. Access the top-tier talent of global professionals, guided by an experienced Creative Director, and leverage cutting-edge technology that practically predicts design and marketing outcomes.
The Designity platform's creative compass points to these key principles for effective infographics and data visualization:
- Simplicity: Keep it clean and crisp.
- Hierarchy: Organize with a sprinkle of visual hierarchy magic.
- Balance: It's like finding the perfect balance between chocolate and peanut butter.
- Contrast: Think yin-yang vibes – balance the light and dark.
- Consistency: Like your favorite playlist, make sure it flows smoothly.
About Infographics and Data Visualization: Infographics and data visualization specialists are the visual storytellers who transform complex information into digestible, engaging visuals. Their skills encompass creating visually stunning graphics, whether it's informative data charts, interactive infographics, or captivating data-driven illustrations. These services span from concept to execution, weaving together design elements like layout, typography, and color theory to deliver compelling results.
What makes infographics and data visualization specialists remarkable is their ability to turn data into a visually appealing narrative. Need to convey intricate statistics in an accessible manner? Call in the infographics and data viz experts. Want to make complex trends and insights crystal clear? They've got the tools to make it happen. Together, they transform data into a visual masterpiece, ensuring your audience not only understands but also enjoys the journey. It's like turning data into art!
Infographics and data visualization benefit from a variety of tools, with Adobe Illustrator being a staple for creating intricate visuals. Additionally, data visualization specialists often turn to tools like Tableau, D3.js, and Power BI to transform complex data into compelling visuals. For more accessible infographic creation, Canva and Piktochart offer user-friendly platforms with pre-designed templates. Embracing a mix of these tools can elevate your data-driven storytelling.
Infographics and data visualization are marketing powerhouses that turn complex information into easily digestible visuals. They grab attention with engaging graphics, concise text, and organized data, making even the most intricate details comprehensible. Infographics distill large amounts of information into bite-sized, shareable content, making them ideal for social media and content marketing. Data visualizations, on the other hand, uncover insights, trends, and patterns that support data-driven decision-making. They enhance the credibility of marketing messages and provide valuable information to audiences. In marketing, infographics and data visualization enhance engagement, convey authority, and transform data into a compelling narrative.
The main purpose of infographics and data visualization is to simplify and communicate complex information effectively. Infographics distill data and ideas into visually appealing and easy-to-understand graphics, enhancing audience engagement and comprehension. Data visualizations provide clarity and insights, helping marketers present data in a compelling and informative manner. Together, they empower marketing efforts by making information accessible, shareable, and persuasive.
Platforms like Fiverr and Upwork offer a range of freelance designers with varying expertise levels. But guess what? You've just stumbled upon the gateway to the top 1% of global creatives and Marketers! No need to scour the internet – Designity's platform is your shortcut to cost-effective creative solutions. Say goodbye to the hassle of managing multiple freelancers. With Designity, you get quality control, creative direction, and project management all in one place.
Finding a local infographic & data visualization designer is easier than you think. Start by tapping into your local business network and conducting Google searches to explore available designers in your area. Then, take a look at the top 1% of global creatives and Marketers within Designity's creative and marketing community. Whether you're near or far, Designity's platform connects you with a top-notch global creative and marketing team. With Designity, geographical boundaries won't limit your access to skilled designers.
The future of infographic & data visualization services is gearing up to be an even more dynamic and immersive experience than ever before. As technology continues to evolve, expect to see interactive and engaging visualizations that allow users to dive deeper into data stories. AI might play a role in simplifying complex information, making it more accessible to a wider audience. AR could also step in, bringing data visualizations into the real world. With innovations like NFTs on the horizon, the future of infographic & data visualization services promises to be a captivating journey into the realm of information exploration.
AI is like a reliable assistant for infographic & data visualization designers, introducing new dimensions of efficiency and innovation. Instead of replacing human creativity, AI enhances it. Algorithms can now swiftly process large datasets and extract meaningful insights, helping designers craft visually engaging and data-driven infographics. AI also assists in suggesting appropriate visual representations for complex information, making data more understandable and relatable.
Yet, AI's impact goes beyond automation. Machine learning algorithms are evolving to predict design trends and user preferences, aiding designers in creating visuals that resonate with audiences. AI can even contribute to interactive infographics, adapting content based on user interactions. This synergy of AI and human creativity expands the possibilities of infographic & data visualization, resulting in more insightful, engaging, and effective ways of communicating complex information.
Infographic and data visualization designers offer a range of services tailored to visually communicate complex data and information in a clear and engaging manner.
These services may include creating informative and visually appealing infographics, data-driven charts and graphs, interactive data visualizations, and custom illustrations to present data in a simpler, easy-to-digest format. They specialize in translating raw data into visual stories that help businesses and organizations convey their messages effectively to their target audience.
Whether it’s for marketing campaigns, reports, presentations, or websites, infographic and data visualization designers play a crucial role in making data more accessible and impactful.